source code: GSE-source.zip
executable: GSE.zip
Project Demonstration
• Graph Drawing by Equation
• Graph Drawing by Sketch
• Graph Editing
1. Overview of GSE
Drawing graphs is one of the most effective ways in communicating mathematical concepts. But in the e-learning environment today, drawing proper graph is extremely difficult. Consequently, math education thru the internet is still quit ineffective. We developed GSE (Graph-Drawing System for Education) which helps users to draw mathematical graphs easily and quickly to overcome such difficulties.
GSE provides sketch-based user interface. When user sketches schematic shapes of graphs, the system generates appropriate graphs automatically. Moreover GSE supports displaying supplementary information for mathematics education such as mensuration, tangent line, intersection points, coordinate value. etc.
2. Graph Drawing
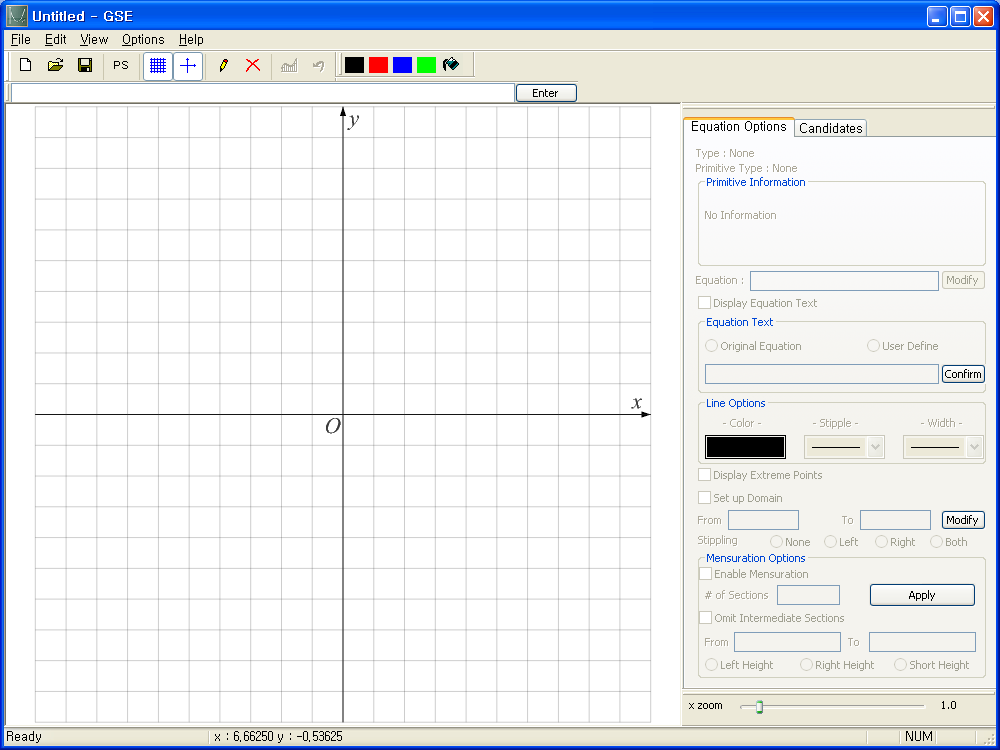
When you start GSE, you may see Figure1.
Figure 1
2.1 Graph drawing by equation
You can simply type up the equation of fucntion that you want to draw at the top of the white board. If you want to draw an explicit function, the equation must start with " ![]() "; otherwise, if you want to draw implicit function, the equation must end with "
"; otherwise, if you want to draw implicit function, the equation must end with "![]() ". For example, If you want to draw straight line
". For example, If you want to draw straight line ![]() then you have to type "y=2*x+1". And If you want to draw unit a unit circle
then you have to type "y=2*x+1". And If you want to draw unit a unit circle ![]() , you have to type " x^2+y^2-1=0"
, you have to type " x^2+y^2-1=0"
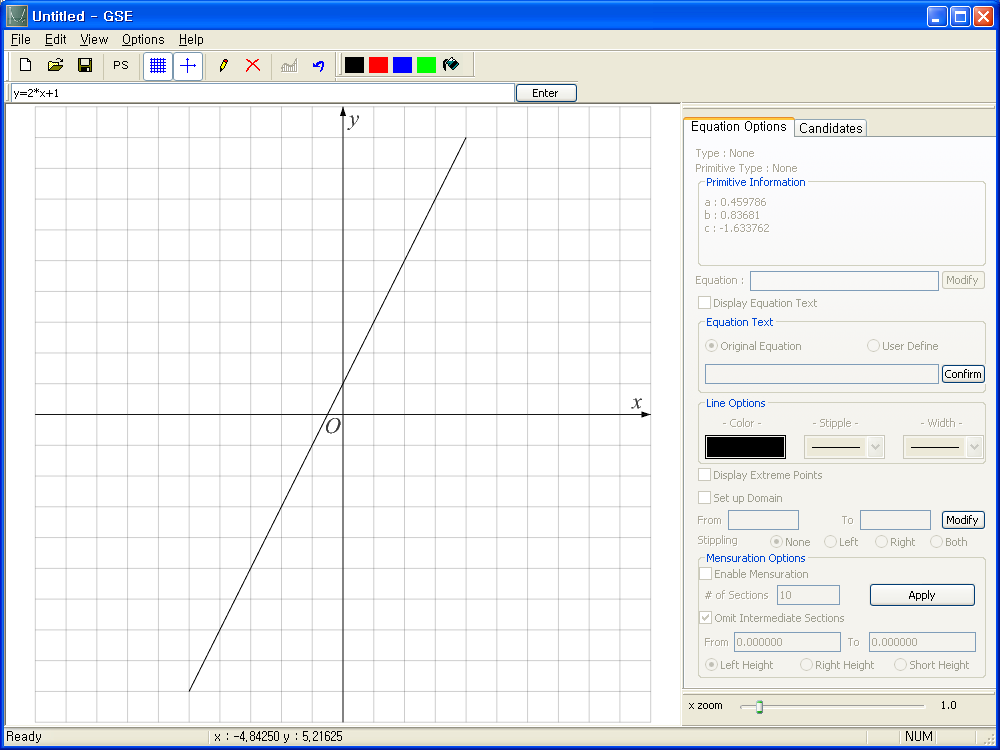
Figure 2
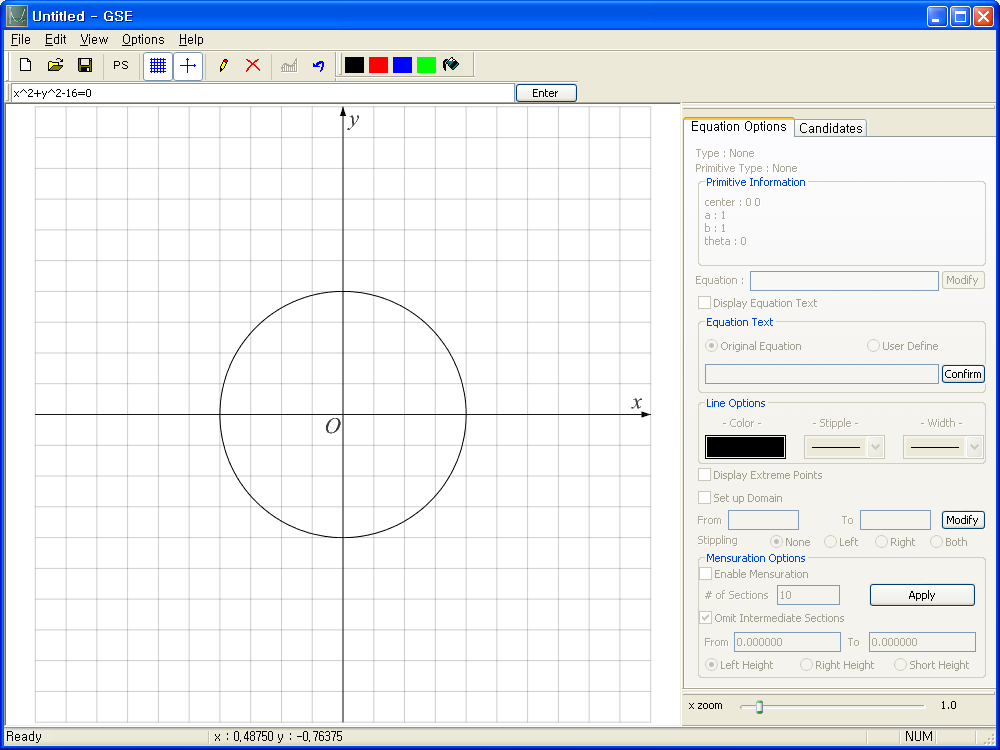
Figure 3
2.2 Graph drawing by sketch
Click the pencil button ![]() or double click the white board. Then you can start a sketch for the graph.
or double click the white board. Then you can start a sketch for the graph.
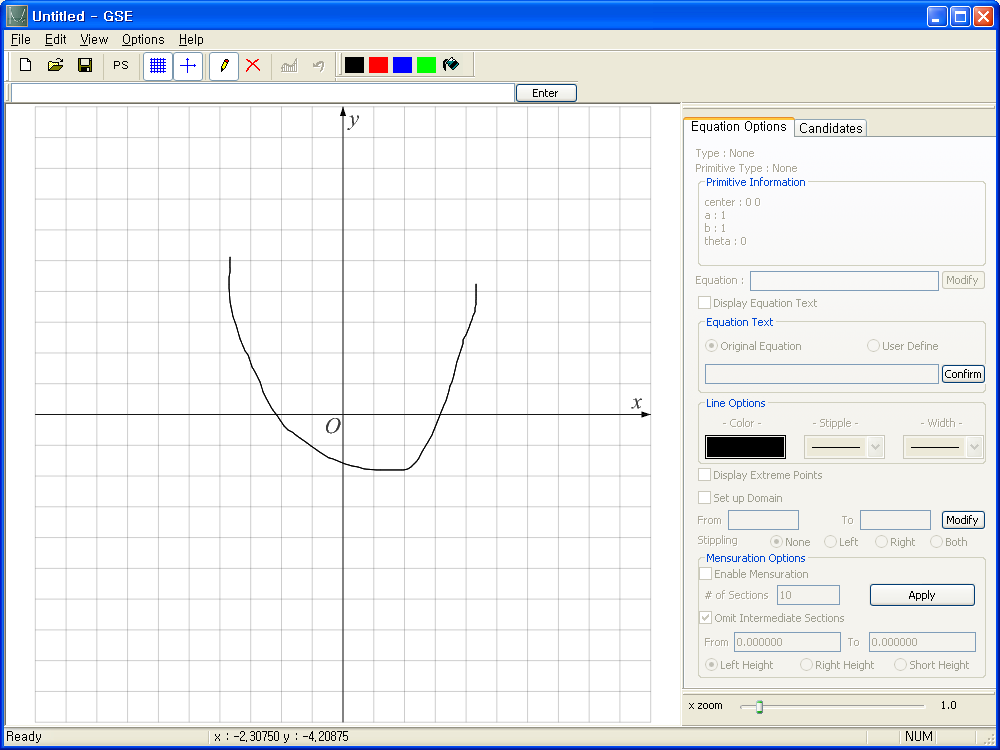
Figure 4
When the sketch is over, Click the pencil button ![]() one more time or double click the board again. Then you will get an automatically generated graph.
one more time or double click the board again. Then you will get an automatically generated graph.
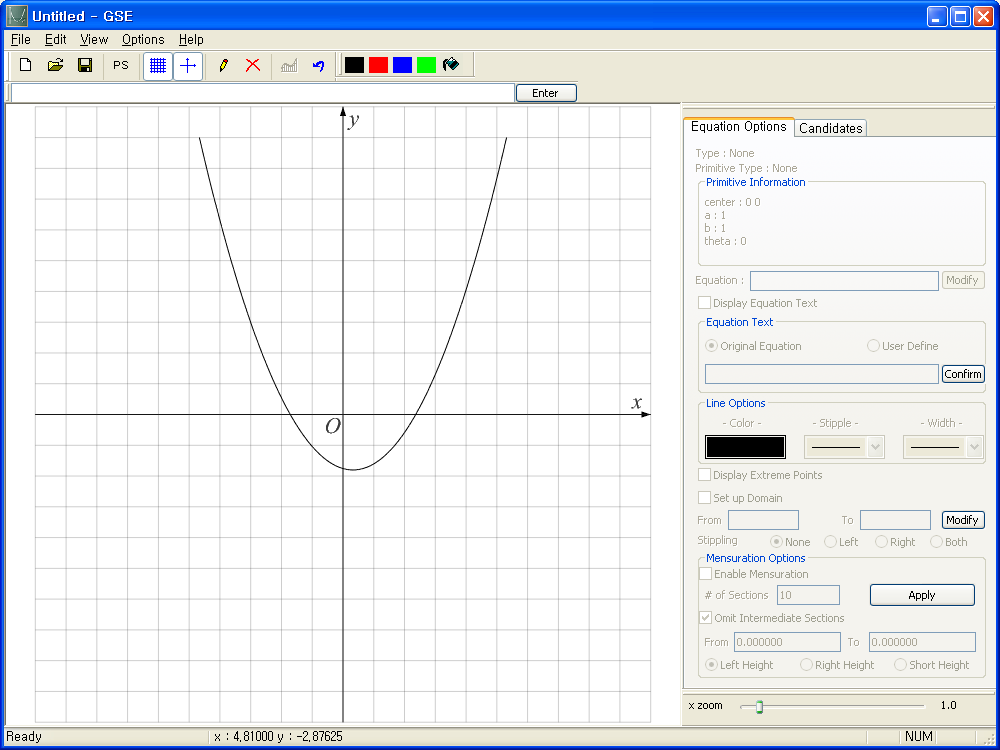
Figure 5
3. Displaying supplementary information
In math educational point of view, supplementary information is sometimes even more important than graph itself. After Drawing a graph as above, the user can input supplementary information by several clicks.
3.1 Tangent Line
User can draw a tangent line by choosing a point of contact. Right click a point on the graph, and choose an item from the tangent line menu.
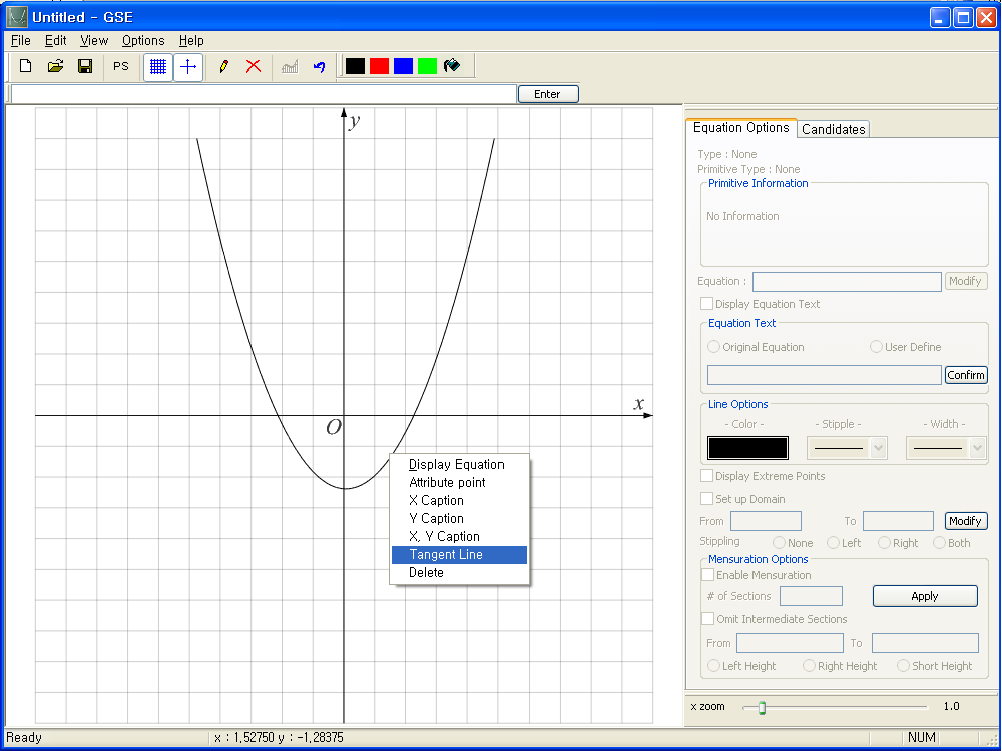
Figure 6
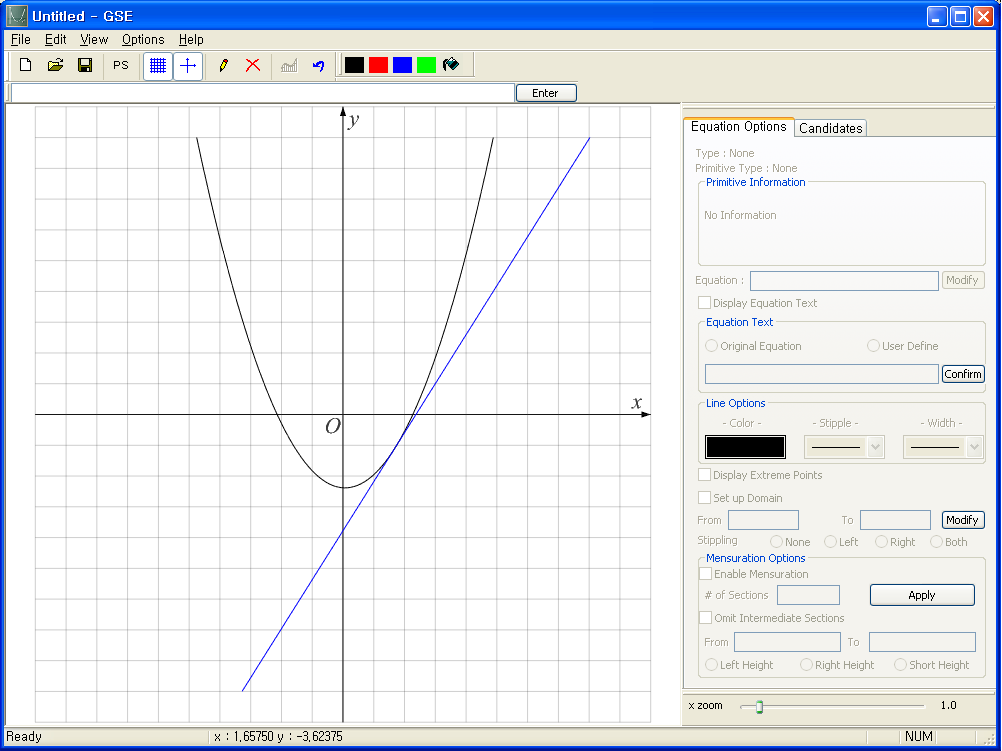
Figure 7
User can also draw a tangent line by choosing a point outside of the graph. After drawing the graph, right click a point out side of the graph and click an item on the tangent line menu.
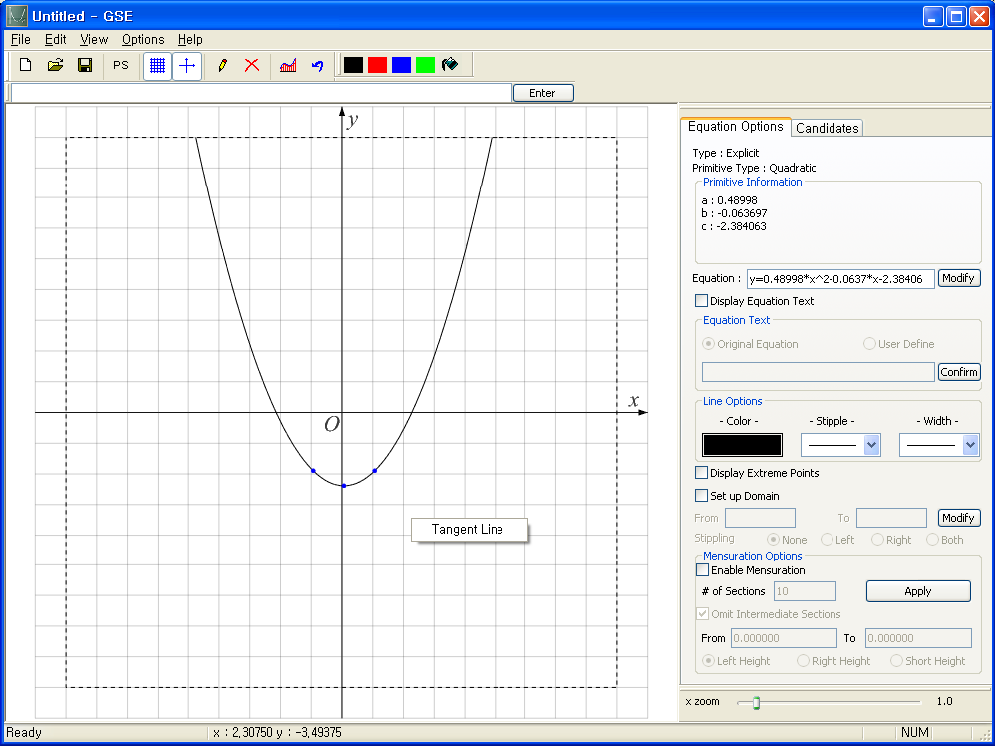
Figure 8
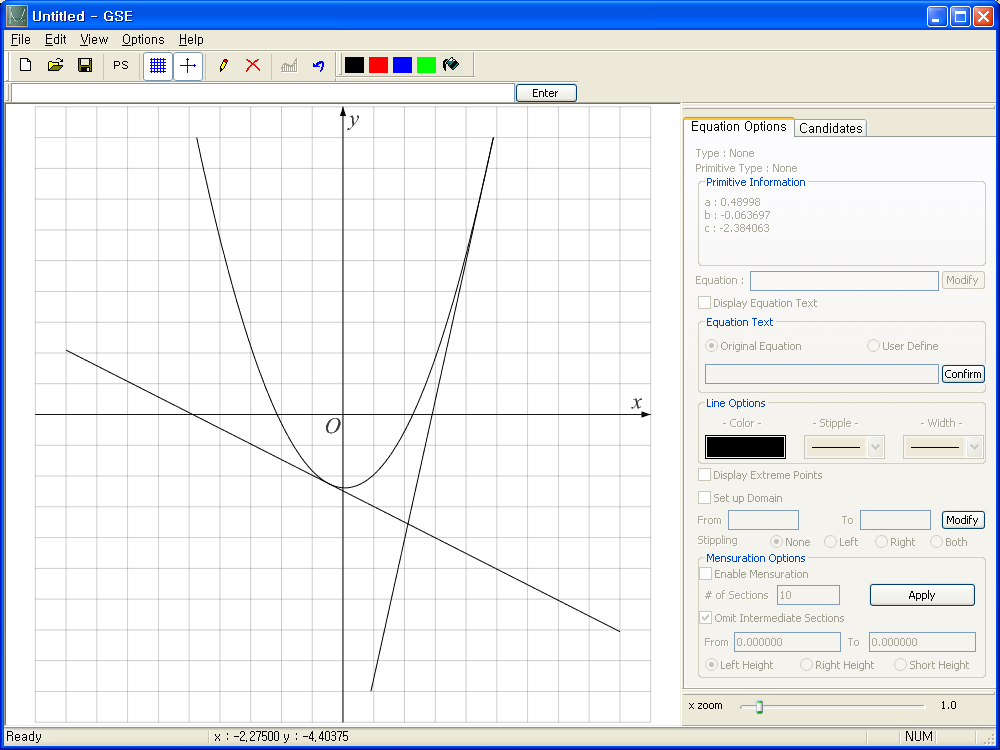
Figure 9
3.2 Mensuration
First, choose the graph to which you want to attach the mesuration .
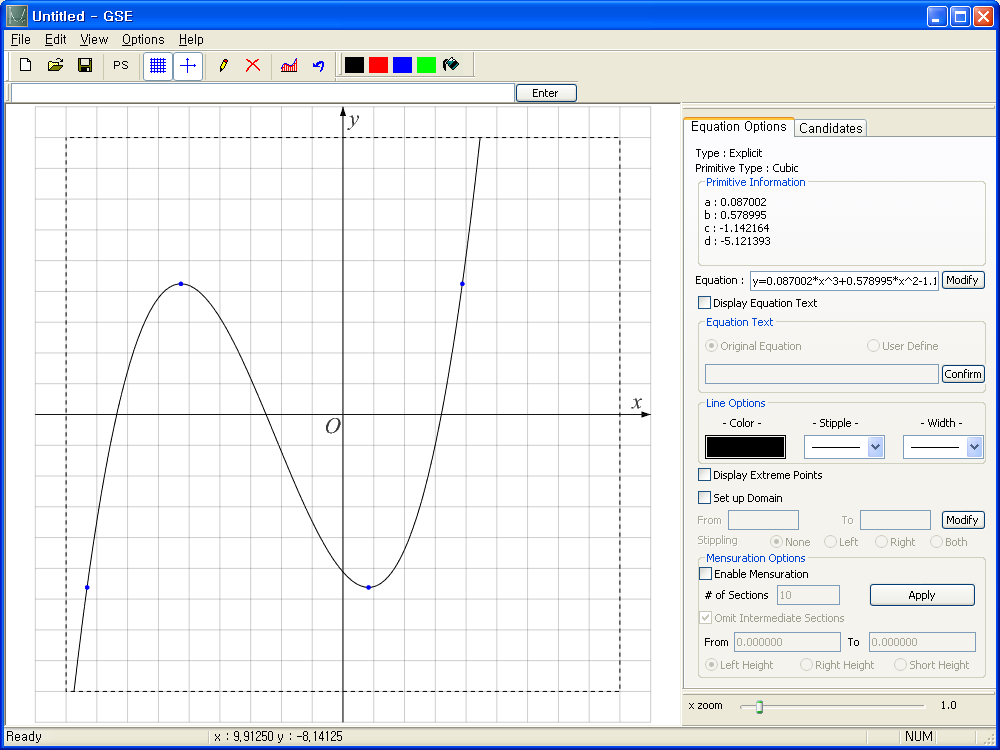
Figure 10
click the mensuration button ![]() and set the range of mesuration by mouse dragging.
and set the range of mesuration by mouse dragging.
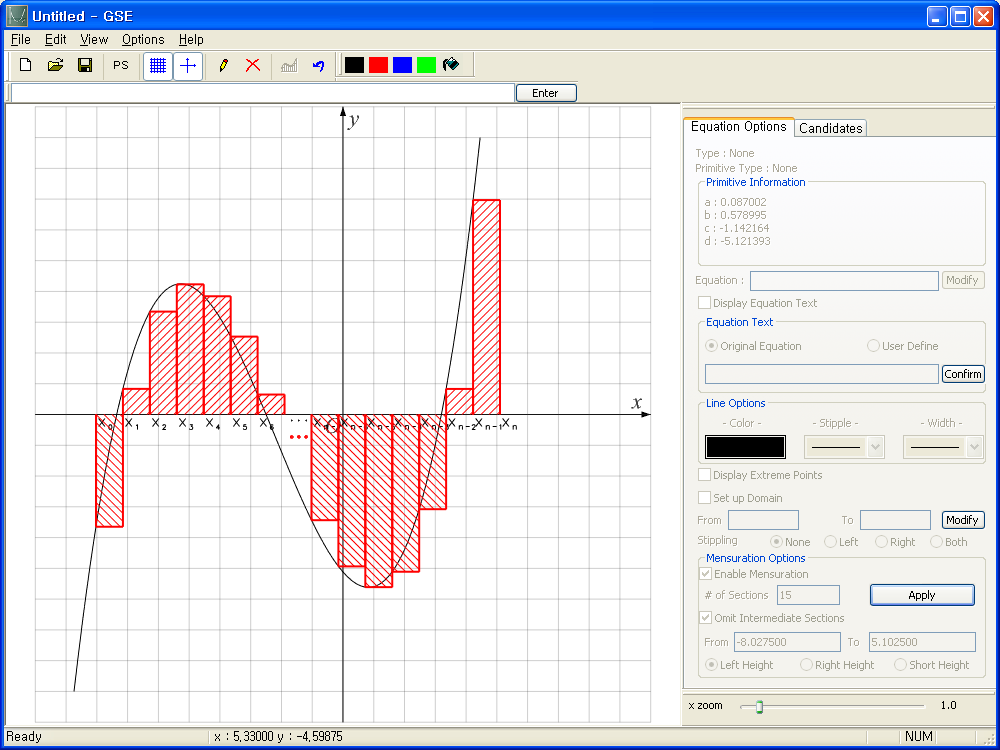
Figure 11
3.3 Attribute point
Attribute point is a point on the graph , which can indicate coordinate values and whether the point is occupied or vacant. Right click a point on the graph and select an item from 'attribute point' menu. Then you will see the gray point on the graph.
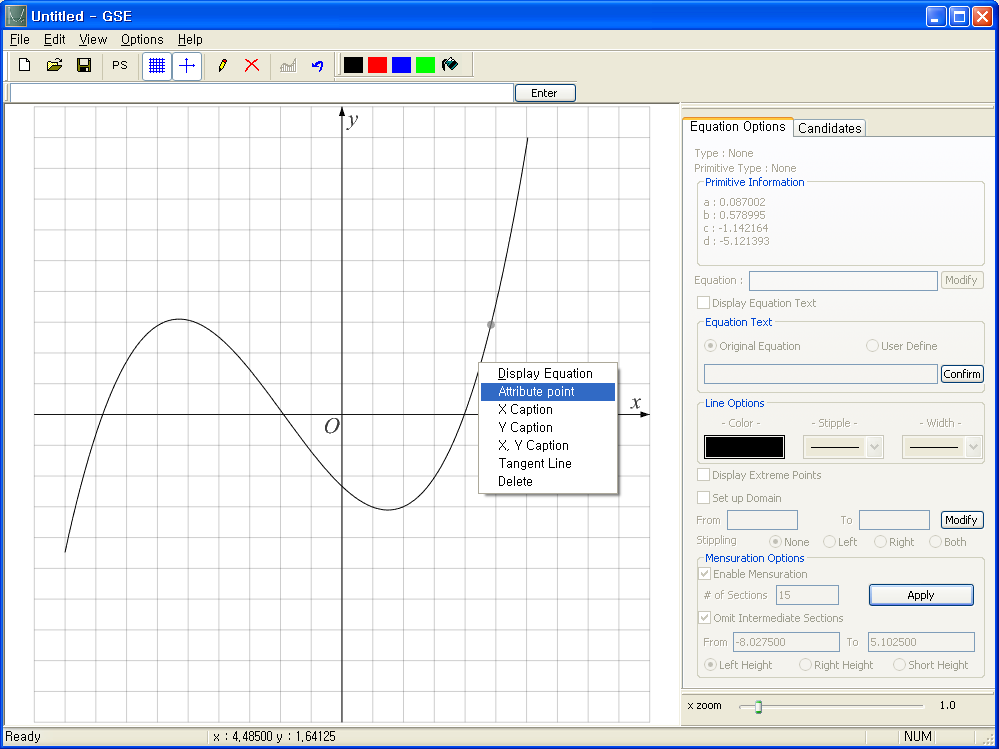
Figure 12
Right click the gray attribute point and select an item from 'option' menu. Then you can make the attribute point indicates coordinate values and also make it either a vacant or occupied point.
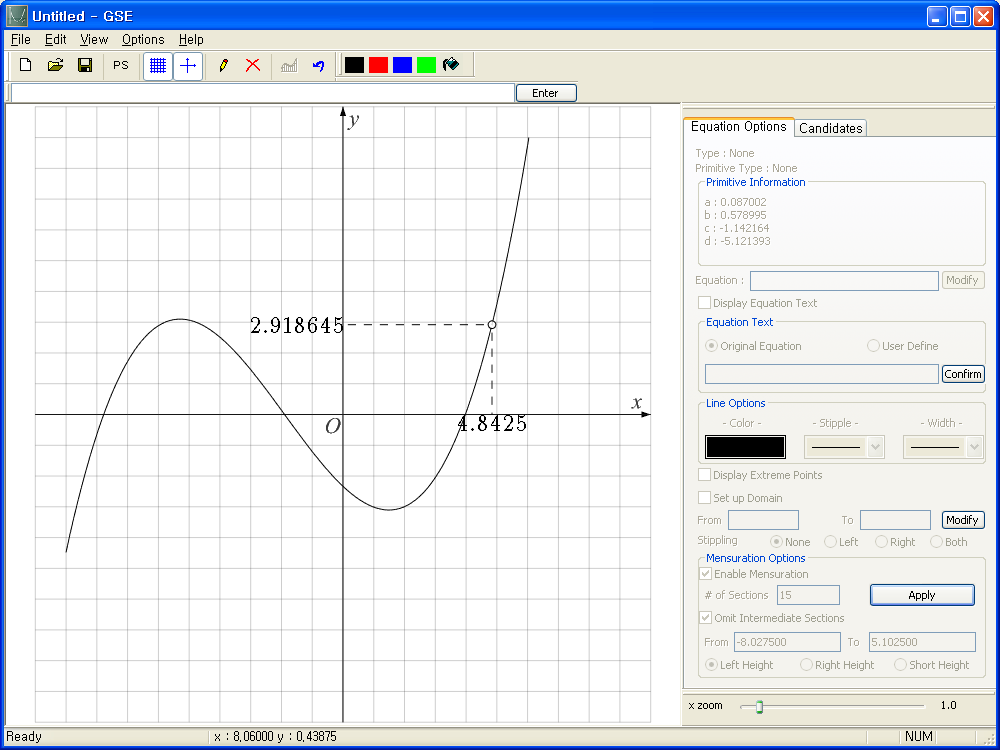
Figure 13
3.4 Domain Restriction
In the middle school and high school curriculum, there are many graphs with restriced domain. User can set the domain of graph on the equation dialog bar on the right subwindow.
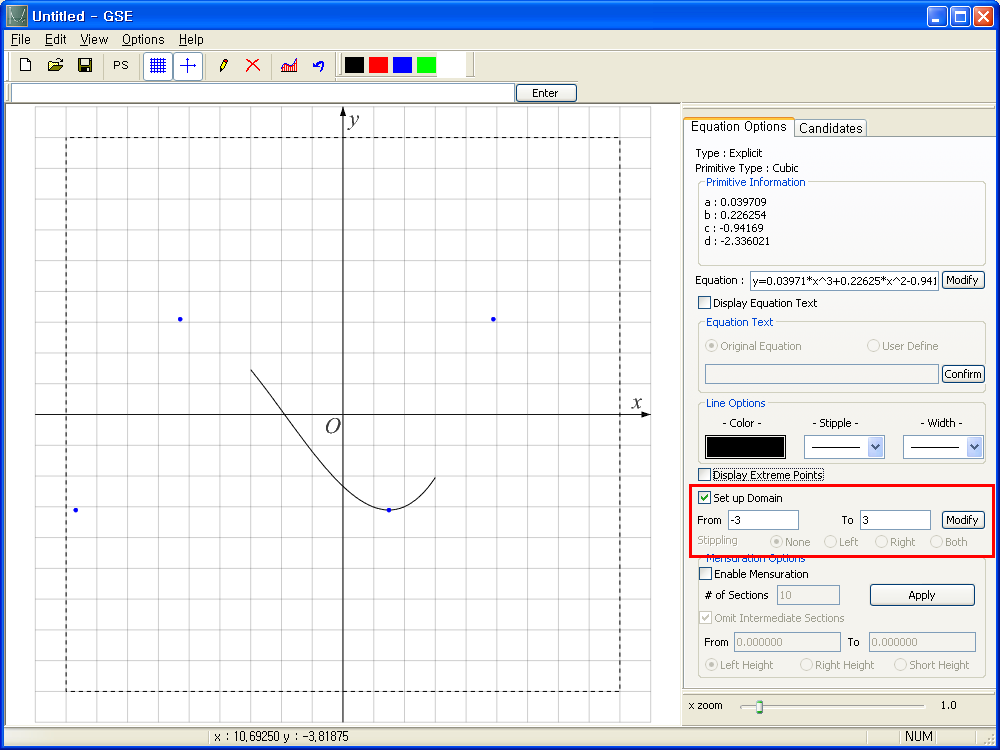
Figure 14
3.5 Area of inequality
User can fill the bounded area by a specific color. Click the ![]() button and select a color. Then the cursor will be changed to
button and select a color. Then the cursor will be changed to ![]() . Click the bounded area to fill.
. Click the bounded area to fill.
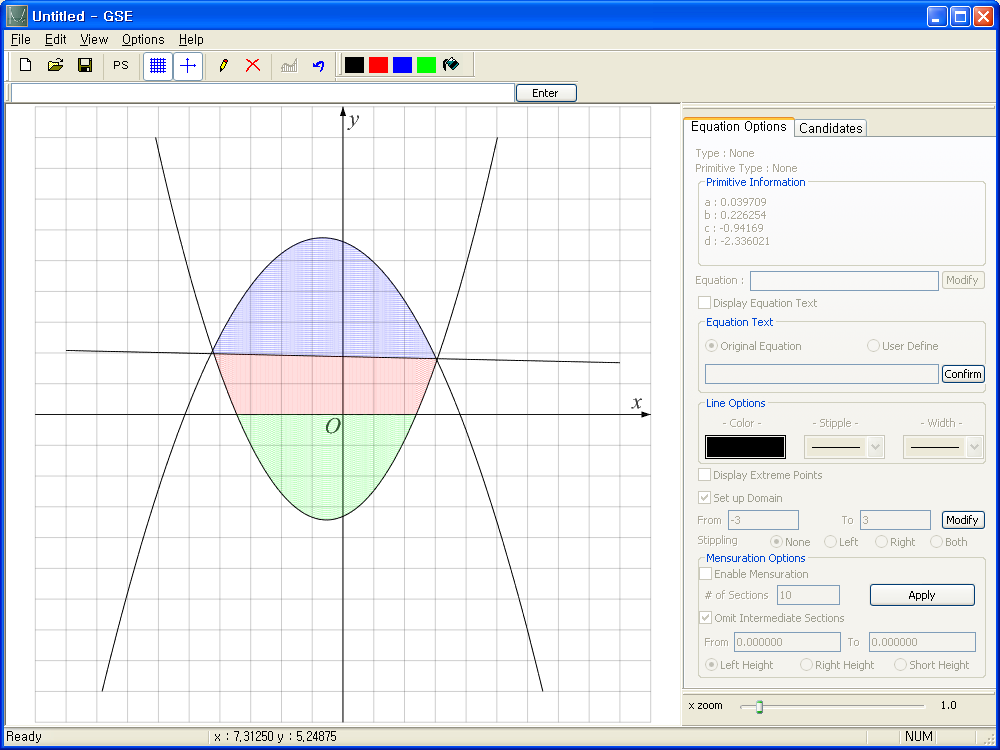
Figure 15